
Top Line
- Inflation shows nascent signs of slowing
- Even the “sticky” rent of shelter component slowed
- Housing prices falter as the Federal Reserve stays steady
Talking Points
Inflation slows, but pressures persist – Markets sighed in relief last Thursday as the Consumer Price Index (CPI) showed that consumer prices, while still elevated on a year-over-year basis, slowed from multi-decade highs in October.
- The headline CPI came in at 7.7 percent, below expectations of 7.9 percent and September’s 8.2 percent figure
- Core-CPI, which strips out the more volatile food and energy indices, came in at 6.3 percent, below the consensus estimate of 6.5 percent and September’s 6.6 percent level
- Federal funds futures priced a 50bp hike at the upcoming December 13-14 meeting with near certainty, pushing the likelihood of a 75bp hike further away
- The Wall Street Journal reporter and Fed whisperer Nick Timiraos, followed the CPI release with an article stating that 50bps is on track for December
- The yield curve inverted further, pressing the spread between the 10yr and federal funds negative for the first time since the pandemic
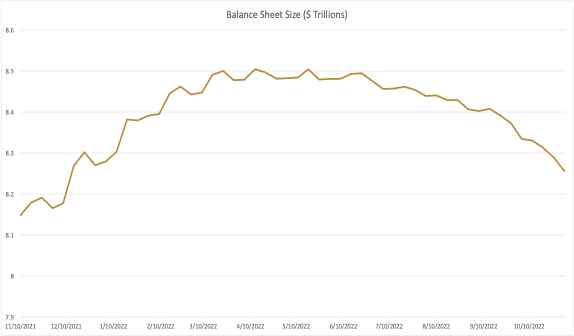
The policy statement released at the conclusion of November’s Federal Open Market Committee meeting changed the scope of data filtering into the central bank’s decision-making framework. The Fed will now be looking at the cumulative effects of tightening monetary policy, which affects the economy with a lag. The change in calculus was taken to mean that policymakers will slow future increases of rate hikes as they incorporate more inputs. Also notable, the statement implied that the effects of rate hikes and Quantitative Tightening (QT) will be looked at collectively. Balance sheet runoff, or outright sales of securities, will act as weights on the financial system, drawing out available capital and acting as a de facto tightening force. If QT runs faster than expected, liquidity will decrease more than expected and spreads may widen given a larger supply of MBS securities in the marketplace. If QT runs slower than expected, the opposite is true with less supply in markets leading to tighter spreads.
How sticky is the Rent of Shelter Index? With its 75bp rate hike on November 2, the Fed took another stride toward its goal of elevating the risk-free rate of interest to a level it believes will hasten the return of unemployment to a level consistent with the Non-Accelerating Inflation Rate of Unemployment. Following another expected target rate hike in December, the Fed is anticipated to become more “data dependent.” In other words, policymakers next year will be more inclined to consider observed changes in the inflation rate when setting the federal funds target than they were in the initial phase of the tightening cycle.
The most influential data will be the CPI and the Fed’s preferred gauge of inflation—the Personal Consumption Expenditures price index. As we have noted in the past, the Rent of Shelter and Rent components comprise around 30 percent of CPI but only with a meaningful time lag.
This dynamic raises the question: how long is the lag between the month households experience rent increases and the month these hikes are manifested in CPI releases? We performed a bit of statistical modeling to get closer to an answer. The most granular estimates of household rents available come from commercial sources of apartment data. We elected to use the Reis data series for this purpose, which provides monthly average unit rent measurements from January 2009 to September 2022. We also used the Rent of Shelter Index (ROSI), which as mentioned above is a subindex of CPI. We found that ROSI was highly correlated to year-over-year changes in the Reis rent series with a lag of approximately three months. We further found that the ROSI was correlated to CPI, but with a six-month lag.
Using these two data sets, it appears that changes in apartment rent trends foreshadow changes in the CPI with a lag of three to nine months. The Reis year-over-year rent series started to decline materially in September. Thus, we should expect to see similar weakening in the CPI (all else equal) during the winter and spring.
Rates rise and housing stalls – While housing prices are still rising on a year-over-year basis, data suggests that month-over month prices are beginning to fall. The Case-Shiller National Housing Price Index has risen 9.01 percent year to date but fell -0.93 percent and -1.07 percent over the three- and one-month periods, respectively, through August. These are the first month-over-month declines since 2012.
The Fed, too, has been keeping an eye on this sector as it represents a major part of the economy. In its semiannual Financial Stability Report, released on November 4, the central bank noted that “with valuations at high levels, house prices could be particularly sensitive to shocks,” with researchers at both Goldman Sachs and Moody’s Analytics predicting peak-to-trough drops in house prices of 7.6 percent and 10 percent respectively.
The slowing and outright decline of house prices is largely a function of rising mortgage rates which make borrowing money increasingly costly. Data from Freddie Mac indicates that 30-year fixed-rate mortgages are being taken out at an average rate of 7.08 percent—410bps higher than a year ago and tied with the multi-decade high reached two weeks ago. Higher interest rates mean that borrowers get less buying power (all else equal) and this quashes demand, therefore lowering housing prices. This dynamic plays out in commercial real estate markets as well, with rising rates and widening spreads causing loan proceeds to fall short therefore diminishing demand. This feedback loop should be expected to continue given the rate environment and should help lower inflation and inflationary expectation in the near to medium term.

The Week Ahead
This week’s main event comes tomorrow in the release of the Producer Price Index, expected to show a decelerating 8.4 percent year-over-year print for October. Retail sales will provide insight into consumer health on Wednesday and import/export prices will add further nuance to the inflationary picture. Wednesday will also provide data surrounding capacity utilization, business inventories, and the National Association of Home Builders Housing Market Index. On Thursday, building permit, housing starts, and jobless claims will be in the spotlight. Finally, Friday will see existing home sales, expected to decline 7.1 percent in October, more than the 1.5 percent decline in September.
Economic Calendar
| Indicator | Release | Period | Concensus | Prior |
|---|---|---|---|---|
| Headline PPI | 11/15 | Oct | 8.4% | 8.5% |
| Core PPI | 11/15 | Oct | N/A | 5.6% |
| Retail Sales (MOM) | 11/16 | Oct | 1.1% | 0.0% |
| Import Prices | 11/16 | Oct | N/A | 6.0% |
| Housing Starts | 11/17 | Oct | 1425k | 1439k |
| Initial Jobless Claims | 11/17 | 12-Nov | N/A | 5.0% |
| Existing Home Sales (MOM) | 11/18 | Oct | -7.1% | -1.5% |
Summary of Global Fixed-Income Markets
| Fixed Income | |||||||
| America | Rate | Daily % | 3 Month Δ | 6 Month Δ | 12 Month Δ | 3.94% | |
| Two Year | 4.67% | 0.02% | 1.40% | 2.07% | 4.25% | 3.94% | |
| Five Year | 4.30% | 0.01% | 1.34% | 1.35% | 3.22% | 3.04% | |
| Ten year | 4.13% | 0.00% | 1.35% | 1.09% | 2.69% | 2.62% | |
| Thirty Year | 4.27% | -0.01% | 1.28% | 1.12% | 2.45% | 2.36% | |
| Curve (10s – 2s) | -0.54% | -0.01% | -0.05% | -0.98% | -1.56% | -1.32% | |
| Curve (30s – 10s) | 0.14% | -0.01% | -0.07% | 0.02% | -0.24% | -0.25% | |
| International Ten Year | |||||||
| Germany | 2.34% | 1.13% | 2.53% | 2.41% | 0.00% | 91.70% | |
| Japan | 0.25% | 0.08% | 0.01% | 0.19% | 0.18% | 0.00% | |
| United Kingdom | 3.51% | -0.04% | 1.54% | 1.56% | 2.69% | 2.54% | |
| Short Term Index | |||||||
| Fed Funds | 4.00% | 0.00% | 1.50% | 3.00% | 3.75% | 3.75% | |
| One Month LIBOR | 3.88% | 0.02% | 1.50% | 3.03% | 3.79% | 3.78% | |
| SOFR | 3.78 | 1.49% | 3.00% | 3.73% | 3.73% | 0.00% | |
| Futures Implied Rate Hikes | Number of Hikes | Probability | Implied Fed Funds | ||||
| 11/14/2022 | 2.259 | 225.9% | 4.418% | ||||
| 2/1/2023 | 3.889 | 163.0% | 4.825% | ||||
| 3/22/2023 | 4.719 | 83.0% | 5.032% | ||||
| 5/3/2023 | 5.051 | 33.2% | 5.116% | ||||
| 6/14/2023 | 5.067 | 1.7% | 5.120% | ||||
The information contained herein, including any expression of opinion, has been obtained from, or is based upon, resources believed to be reliable, but is not guaranteed as to accuracy or completeness. This is not intended to be an offer to buy or sell or a solicitation of an offer to buy or sell securities, if any referred to herein. OREC Securities LLC may from time to time have a position in one or more of any securities mentioned herein. OREC Securities LLC or one of its affiliates may from time to time perform investment banking or other business for any company mentioned.